Oh Deer- APES Activity
1. Name three essential components of habitat (things animals need to survive).
A. Waters
B. Foods
C. Shelters
2. Explain what caused the increase of “deer” during the activity you participated in.
The waters, foods, and shelters are the caused the increase of "deer" during the activity you participated in.
3. Explain what caused the decrease of “deer” during the activity you participated in.
There is lack of resources, fire, predators, drought, and disaster are the caused the decrease of "deer" during the activity you participated in.
4. Define the term limiting factor. Give examples of limiting factors for the deer in our activity.
The limiting factor are limits the growth or development of an organism, population, or process. The examples for it is waters, foods, shelters.
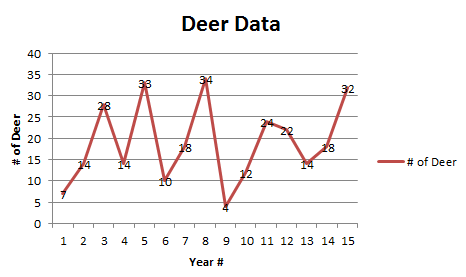
5. Graph the data from the activity and attach to this sheet (make sure to correctly title and label the axes). Describe what the graph of our data looks like. How and why did our deer population change?
Base of the graph, the highest deer through every years is 34. The graph is not going straight like a line but it going up and down.
6. Often we use the phrase “balance of nature” to describe a healthy ecosystem. Based on our graph, what does the “balance of nature” look like? Should we expect populations to be static (unchanging) or do they naturally fluctuate? Explain.
The balance of nature look like the constant flux of the # of deer and the resources. Their naturally fluctuate because the amount of the resources was affect the # of deer.
7. What did you learn about population dynamics by doing this activity?
The things that I learn about population dynamics by doing this activity is the population dynamics is the branch of life sciences that studies short-term and long-term changes in the size and age composition of populations, and the biological and environment processes influencing those changes. The more resources is the high population.
A. Waters
B. Foods
C. Shelters
2. Explain what caused the increase of “deer” during the activity you participated in.
The waters, foods, and shelters are the caused the increase of "deer" during the activity you participated in.
3. Explain what caused the decrease of “deer” during the activity you participated in.
There is lack of resources, fire, predators, drought, and disaster are the caused the decrease of "deer" during the activity you participated in.
4. Define the term limiting factor. Give examples of limiting factors for the deer in our activity.
The limiting factor are limits the growth or development of an organism, population, or process. The examples for it is waters, foods, shelters.
5. Graph the data from the activity and attach to this sheet (make sure to correctly title and label the axes). Describe what the graph of our data looks like. How and why did our deer population change?
Base of the graph, the highest deer through every years is 34. The graph is not going straight like a line but it going up and down.
6. Often we use the phrase “balance of nature” to describe a healthy ecosystem. Based on our graph, what does the “balance of nature” look like? Should we expect populations to be static (unchanging) or do they naturally fluctuate? Explain.
The balance of nature look like the constant flux of the # of deer and the resources. Their naturally fluctuate because the amount of the resources was affect the # of deer.
7. What did you learn about population dynamics by doing this activity?
The things that I learn about population dynamics by doing this activity is the population dynamics is the branch of life sciences that studies short-term and long-term changes in the size and age composition of populations, and the biological and environment processes influencing those changes. The more resources is the high population.